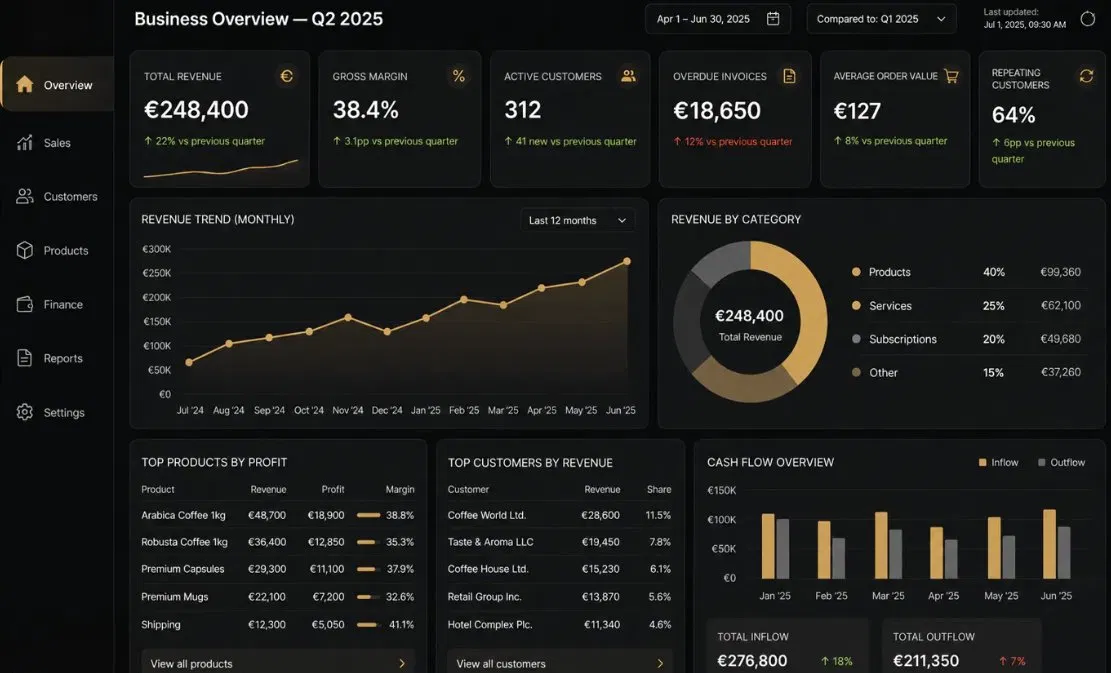
Business Analytics & Data Visualization

Turn data into clarity.

We turn scattered business data into clear dashboards and insights — so you always know what's happening and what to do next.

Monthly Revenue
€84,200 ↑ 18.4%
Gross Margin
42.7%
Active Clients
136
Top Product
SKU-04
Retention
78%
The Problem

Most companies have data.
Few have clarity.

Data sits scattered across Excel files, ERP systems, and manual reports. We bring it together and make it readable.

💰

Hidden profitability

You don't know which clients or products are driving profit — and which are quietly draining it.

🗂

Manual reporting

Hours spent copy-pasting between systems, building the same Excel reports every month, chasing numbers that never quite match.

📉

Outdated insights

By the time reports reach your inbox, the business has already moved on. You need visibility into what's happening now — not what happened last month.

Services

Four ways we bring
clarity to your data.

Each service is designed to solve a specific data problem — and together they give you complete visibility into your business.

01

Business Dashboards

Interactive dashboards that show you revenue, profit, customers, and performance — updated automatically, in one place.

RevenueProfitClients
02

Data Analysis

We analyse your existing data and deliver concrete business conclusions — which clients are most valuable, which products to cut, what trends to act on.

InsightsTrendsMargins
03

Reporting Automation

Replace repetitive manual reports with automated flows. Your numbers are always ready — without the weekly Excel marathon.

AutomationAccuracyTime saved
04

KPI Tracking

Define and monitor the metrics that matter most to your business. Always know where you stand — and what needs attention.

RevenueMarginRetention
Process

From messy data to
clear decisions.

A simple four-step process. No disruption to your business — just steadily clearer visibility.

1

Understand

We learn your business, goals, and what decisions you need better data for.

2

Connect

We gather and structure data from your existing tools — Excel, ERP, CRM, accounting software.

3

Visualize

We build dashboards and analyses that show exactly what's happening in your business.

4

Improve

We support and evolve your analytics as your business grows and your questions change.

Example

This is what a
DATERA dashboard looks like.

Real KPIs, real trends — all in one view. Every dashboard is tailored to your specific business.

Business Performance — Q2 2025 Live data
Total Revenue
€248,400
↑ 22% vs last quarter
Gross Margin
38.4%
↑ 3.1pp improvement
Active Customers
312
↑ 41 new this quarter
Retention Rate
81%
↑ 5% vs same period
Monthly Revenue Trend
Revenue by Segment
Products 40%
Services 25%
Other 35%
About DATERA

We're not a software product.
We're your data partner.

DATERA is a boutique analytics service built for small and medium businesses. We speak in business outcomes, not in tools and technologies.

Most businesses already have the data they need. They just can't see it clearly yet. That's what we fix.

What you'll know with DATERA
Which clients generate the most profit
Which products are underperforming
Where time and resources are being lost
How your business is trending month over month
Which KPIs need your attention right now
Contact

Let's make your data
work for you.

We usually respond within 24 hours.

✓ Message sent! We'll be in touch within 24 hours.